General Motors Stock (GM): Analysis, Valuation, and 2026 Outlook
GM stock trades at ~6x forward earnings while returning $23B to shareholders. Here's what Q1 2026 earnings, tariffs, and the software story mean for investors.

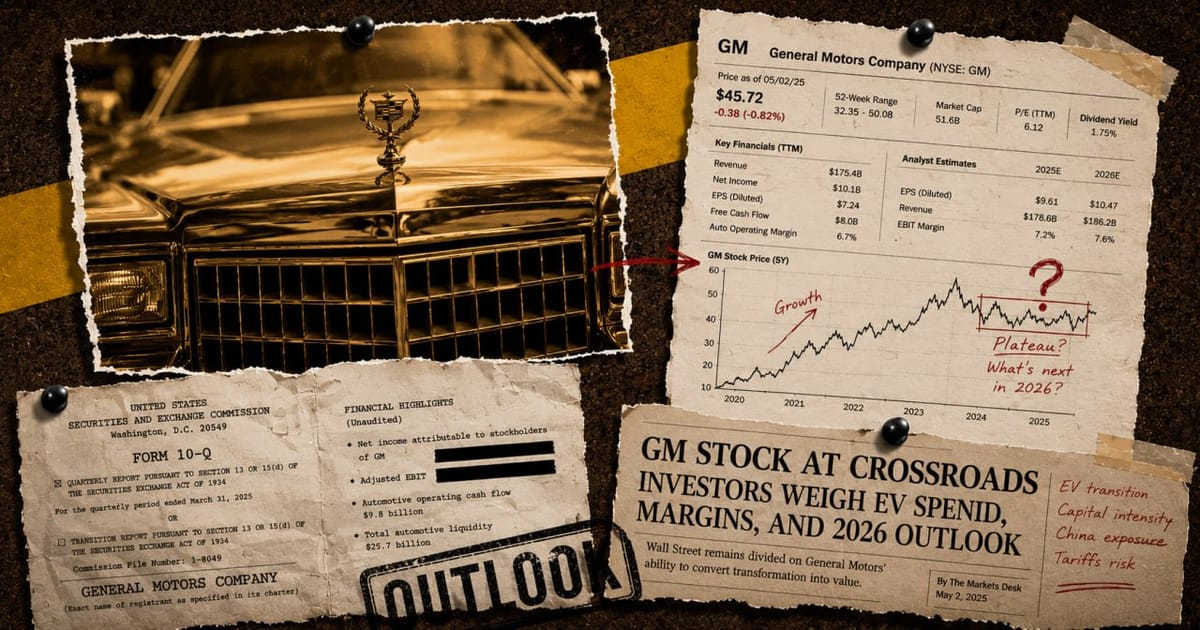
General Motors (NYSE: GM) produced $185 billion in revenue in 2025, delivered adjusted earnings before interest and taxes of $12.7 billion, and returned $23 billion to shareholders since late 2023 by buying back approximately 465 million shares. In Q1 2026, the company beat adjusted earnings-per-share estimates by 40%, raised full-year guidance, and continued shrinking its electric vehicle losses. This article covers GM's financials, its core profit drivers, the tariff risk, the OnStar software opportunity, and what analysts think the stock is worth.
General Motors: Quick stats
- Q1 2026 adjusted EPS: $3.70, beating expectations of $2.64 by more than 40%
- 2026 full-year EBIT guidance (raised after Q1): $13.5 billion to $15.5 billion
- 2026 net income guidance: $10.3 billion to $11.7 billion
- Free cash flow guidance for 2026: $9 billion to $11 billion
- Forward P/E ratio: approximately 6x
- Analyst consensus price target: $94 to $96 (19 Buy ratings, 6 Hold, 2 Sell among 26 analysts)
- Shares repurchased since late 2023: approximately 465 million retired (share count reduced from approximately 1.4 billion to approximately 900 million as of year-end 2025)
Table of Contents
- What General Motors Actually Does
- Financial Performance: 2025 Results and 2026 Guidance
- The Profit Engine: Trucks and Full-Size SUVs
- The Hidden Growth Driver: Software and Services
- The EV Reset: What the $7.6 Billion Writedown Means
- Tariffs: How Big Is the Risk to GM Stock?
- Shareholder Returns: Dividends and Buybacks
- Valuation: Forward vs. Trailing PE, and What It Means
- Bull Case for GM Stock
- Bear Case for GM Stock
- GM Stock vs. Ford Stock
- Analyst Price Targets and Wall Street Consensus
- Frequently Asked Questions for General Motors Stock
What General Motors Actually Does
General Motors is the largest U.S. automaker by volume, operating four consumer brands: Chevrolet, GMC, Buick, and Cadillac. It held 17% of the U.S. market in 2025, its highest level in a decade, and reported full-year global sales that grew 6%, with all four brands posting gains.
The company reports through four segments. GM North America (GMNA) is the core profit generator, consistently running EBIT margins above 8%. GM International (GMI) covers markets outside North America, including China, which GM operates through joint ventures with SAIC Motor. The Cruise segment handles autonomous vehicle development. Corporate handles treasury, finance, and the GM Financial captive lending arm.
GM Financial is worth noting separately. The subsidiary provides auto loans and leases to retail customers and dealerships, contributing roughly $17 billion in revenue in 2025 and acting as a stable, recurring earnings stream that cushions the cyclicality of vehicle sales.
The day-to-day business is simpler than the financials suggest: GM makes most of its profit by selling full-size trucks and large SUVs in the United States. Everything else, from EVs to China to software, is secondary to that core.
Financial Performance: 2025 Results and 2026 Guidance
GM's 2025 headline net income of $2.7 billion looks modest for a company of its size, but that figure is almost entirely an artifact of accounting. In the fourth quarter of 2025, GM recorded more than $7.2 billion in special charges tied to a realignment of its electric vehicle manufacturing capacity and a response to the elimination of federal EV consumer incentives. Strip those out, and the underlying business earned $12.7 billion in adjusted EBIT for the full year, generated $10.6 billion in adjusted free cash flow, and ended the year with $20.9 billion in cash and cash equivalents.
Q1 2026 showed that momentum has continued. GM posted adjusted EPS of $3.70 in the first quarter, compared with $2.78 a year earlier, exceeding Wall Street's consensus estimate of $2.64 by more than 40%. Revenue came in at $43.6 billion, essentially flat with $44.0 billion in Q1 2025. North American EBIT margin held at 10.1%.
On the back of that result, GM raised its full-year 2026 guidance. The company now expects:
- Adjusted EBIT of $13.5 billion to $15.5 billion, up from the original $13.0 to $15.0 billion
- Net income attributable to stockholders of $10.3 billion to $11.7 billion
- Adjusted automotive free cash flow of $9.0 billion to $11.0 billion
For context, a midpoint of $10.75 billion in net income guidance implies roughly $11 to $12 in diluted adjusted EPS given the reduced share count from buybacks. That is the earnings base that makes the approximately 6x forward PE possible.
The Profit Engine: Trucks and Full-Size SUVs
Investors who focus on GM's EV headlines often miss the structural advantage sitting underneath: the company's truck and SUV franchise is among the most durable moats in American manufacturing.
In 2025, GM posted its best combined Chevrolet Silverado and GMC Sierra sales in 20 years, with 588,709 Silverado units sold, a 5.1% increase year-over-year. GM held the full-size pickup leadership position for the sixth consecutive year and has led the full-size SUV category for 51 straight years.
Full-size trucks and large SUVs command pricing power that passenger cars cannot match. Buyers pay $55,000 to $80,000 for a well-equipped Silverado or Suburban, and gross margins on these vehicles run substantially above the company average. The North American EBIT margin of 10.1% in Q1 2026 reflects this reality: when trucks sell, GM generates cash at a rate most automakers cannot replicate.
The Equinox crossover has also become a meaningful volume driver. Sales climbed 32.1% in 2025 to 274,356 units, making it Chevrolet's best-selling SUV. The Equinox EV, priced around $32,000 at launch, has given GM a credible entry point into the affordable electric segment and helped Chevrolet reach the second-highest U.S. EV market share after Tesla.
These vehicles collectively fund everything else GM wants to do, from software development to the autonomous vehicle program.
The Hidden Growth Driver: Software and Services
The least-discussed part of the GM investment thesis is the one with the highest long-term margin potential.
GM's software and connected services segment, anchored by OnStar and Super Cruise, generated revenue that was up 65% in 2025. OnStar reached 12 million global subscribers, while Super Cruise, the hands-free driving assistance system, surpassed 620,000 subscribers with an 80% year-over-year increase. Management expects OnStar to approach 13 million subscribers by the end of 2026.
The financial structure of this business is fundamentally different from selling cars. Software and service revenue carries gross margins of approximately 70%, compared with the mid-single-digit margins typical of vehicle manufacturing. GM finished 2025 with $5.4 billion in deferred software and services revenue on its balance sheet, a figure expected to rise to $7.5 billion by the end of 2026, a 40% increase year-over-year.
The long-term target is $25 billion in software and services revenue by 2030. If GM achieves even a fraction of that, it would represent a meaningful earnings contribution at margins the vehicle business will never approach.
OnStar digital services revenue exceeded $750 million in Q1 2026 alone, up 20% year-over-year. Management is beginning to describe this as a higher-margin revenue stream that is far less cyclical than vehicle sales, and for good reason: subscribers pay monthly fees regardless of whether they buy a new car that quarter.
This is the part of the GM story that most competitor articles miss entirely. The traditional auto valuation framework, built around cyclical earnings multiples, does not account for a recurring, high-margin services stream that compounds year-over-year at 20% to 65%.
The EV Reset: What the $7.6 Billion Writedown Means
GM's EV strategy has gone through a dramatic recalibration. The company absorbed $7.6 billion in EV-related restructuring charges in 2025, followed by an additional $1.1 billion in Q1 2026, as it resized its electric vehicle manufacturing footprint to match actual demand.
The most visible signal of this shift came when GM quietly halted development of its next-generation electric truck program at Factory Zero in Detroit, redirecting capital toward gasoline engines and hybrid powertrains. Management cited U.S. EV demand stabilizing at approximately 6% of industry sales, which was below the rate the company had built capacity to serve.
The Ultium battery platform that underpins GM's EV lineup is not being abandoned. The Equinox EV continues to sell, and Chevrolet holds the second-largest U.S. EV market share behind Tesla. But the pace of the EV transition is being managed more conservatively, with GM prioritizing profitability over volume.
On the autonomous vehicle side, GM shut down Cruise's robotaxi operations in early 2025 after completing the acquisition of noncontrolling interests in Cruise. The combined GM and Cruise autonomous driving teams are now focused on personal vehicle technology rather than commercial ridehail fleets. One exception: a joint venture with Honda will launch a driverless ridehail service in Japan starting in early 2026, using the autonomous Origin vehicle.
For GM stock, the EV writedowns are almost entirely backward-looking events. The charges are non-cash or one-time in nature, which is why the forward PE differs so dramatically from the trailing PE. The operational EV business, while not yet profitable at scale, is losing less money per unit as manufacturing efficiencies improve.
Tariffs: How Big Is the Risk to GM Stock?
GM has been unusually transparent about its tariff exposure. Going into 2026, the company had originally guided for gross tariff costs of $3 billion to $4 billion. During Q1, the U.S. Supreme Court ruled that the International Emergency Economic Powers Act (IEEPA) did not authorize certain tariffs, triggering a $500 million favorable tariff adjustment and bringing the Q1 net tariff cost to approximately $200 million. GM subsequently revised its full-year gross tariff guidance down to $2.5 billion to $3.5 billion. Section 232 tariffs on steel and aluminum imports remain intact and represent the primary ongoing cost driver.
To reduce its exposure over time, GM is investing $888 million in its Tonawanda, New York propulsion plant to build its next-generation V-8 engine for full-size trucks, a project that reduces reliance on imported powertrain components, with production starting in 2027. Management has characterized 2025 and 2026 as the peak tariff-impact years, with mitigation measures reducing the burden as domestic production scales up.
The net result: tariffs are a real headwind, but GM has quantified the exposure, is taking concrete steps to offset it, and has already absorbed partial relief from the Supreme Court ruling. At current guidance, a $2.5 to $3.5 billion tariff cost against $13.5 to $15.5 billion in projected EBIT leaves the underlying business substantially profitable. The primary risk is re-escalation of policy that GM cannot predict or hedge.
Shareholder Returns: Dividends and Buybacks
Since late 2023, GM has returned $23 billion to shareholders through share repurchases, retiring approximately 465 million shares in the process. The share count has fallen from approximately 1.4 billion to roughly 900 million as of year-end 2025, a reduction of about 36%. Fewer shares outstanding means each remaining share represents a larger claim on GM's earnings and free cash flow.
In January 2026, GM's board approved a new $6 billion share repurchase authorization alongside a 20% increase in the quarterly dividend, raising it to $0.18 per share. The company has doubled its quarterly dividend payout over the past three years.
The mechanics of buybacks at this scale matter for investors. When GM repurchases shares, it lifts earnings per share even if total net income stays flat. A company earning $10.75 billion distributing those earnings across 900 million shares produces roughly $11.94 per share. At a stock price near $75, that is a P/E of approximately 6.3x. The same earnings base spread across 1.4 billion shares would produce $7.68 per share and a P/E of approximately 9.8x.
GM ended 2025 with $20.9 billion in cash and cash equivalents and is guiding for $9 to $11 billion in adjusted automotive free cash flow in 2026. With $6 billion already committed to buybacks, the remaining cash generation provides flexibility to continue repurchasing shares or increase the dividend further.
Valuation: Forward vs. Trailing PE, and What It Means
The most common mistake investors make when looking at GM's valuation is using the trailing twelve-month price-to-earnings ratio, which has appeared as high as 28x in some 2026 data snapshots. That number is meaningless for valuing the ongoing business.
The inflated trailing PE reflects Q4 2025 net income of negative $3.3 billion, a direct result of the $7.2 billion in non-cash EV restructuring charges booked in that quarter. Those charges do not recur. They do not represent cash leaving the business. They are accounting adjustments for asset values the company decided to write down.
The relevant number is the forward PE, which sits near 6x based on GM's own guidance of $10.3 to $11.7 billion in 2026 net income and an approximately 900 million diluted share count.
| Company | Forward P/E | Free Cash Flow Yield | Quarterly Dividend |
|---|---|---|---|
| GM (NYSE: GM) | ~6x | ~14% | $0.18 (0.96% annualized yield) |
| Toyota (NYSE: TM) | ~10x | ~5-6% | ~2.5% annualized yield |
| Ford (NYSE: F) | N/A (negative trailing earnings) | Lower than GM | $0.15/quarter (variable) |
GM's free cash flow yield of approximately 14%, based on $9 to $11 billion in guided free cash flow against a market cap near $70 billion, is one of the highest in the large-cap auto sector. None of this means the stock is guaranteed to appreciate. Forward guidance can miss. Tariffs can escalate. But the starting valuation is unusually cheap relative to the cash the business generates, which is the foundation of the bull case.
Bull Case for GM Stock
The core argument for owning GM stock at current prices rests on five pillars.
Sub-6x forward earnings with $9 to $11 billion in free cash flow. At this valuation, a simple multiple expansion to 8x forward earnings, still below Toyota's approximately 10x, would place the stock above $90 without any fundamental earnings improvement.
The buyback engine keeps running. With $20.9 billion in cash and $9 to $11 billion in projected annual free cash flow, GM can sustain $6 billion or more in annual buybacks. Each year of buybacks at that pace removes 7 to 9% of the remaining float, lifting per-share earnings regardless of total income growth.
Software and services provide a secular growth layer. A $25 billion software revenue target by 2030 at 70% gross margins would represent a fundamentally different earnings profile than the market currently prices in. Even partial execution would add billions in high-margin earnings on top of the traditional vehicle business.
Trucks are not going away. Consumer demand for full-size pickups and large SUVs has been structurally resilient for more than a decade. GM's six-year streak as full-size pickup leader and its 51-year run as full-size SUV leader are not accidents of timing. That franchise generates the cash that funds everything else.
Tariff headwinds are quantified and peaking. With reshoring investments coming online by 2027 and the Supreme Court's partial tariff relief already booked, the trajectory on tariff costs points down from the 2025 to 2026 peak under current policy.
Bear Case for GM Stock
The risks to the GM investment thesis are real and worth taking seriously.
Tariff escalation beyond current estimates. GM's revised $2.5 to $3.5 billion gross tariff estimate assumes the current policy environment holds. If the administration reimposed IEEPA duties or expanded Section 232 coverage, gross tariff costs could exceed guidance materially. GM has limited ability to rapidly reroute supply chains or shift production.
The EV transition could pressure the core business faster than expected. GM's truck-and-SUV franchise generates exceptional margins in part because gasoline-powered trucks have few direct EV substitutes at similar price points. If that changes, either from domestic EV truck rivals or lower-cost imports, the profit engine could compress.
China is contracting. GM sold 0.3 million vehicles in China in Q1 2026, representing a 6.9% market share in a market where domestic brands and BYD have steadily taken share from foreign automakers. Industry sales in China fell 12.9% year-over-year in Q1 2026. China contributed profitable quarters for GM six consecutive times, but the volume trajectory is clearly downward, and the joint-venture structure limits how directly GM can respond to competitive pressure.
Execution risk on software. A $25 billion software revenue target is not a guarantee. OnStar's 12 million subscribers are growing, but converting them into high-margin recurring revenue at the scale GM projects requires continued product investment, competitive pricing, and subscriber retention in a market where other automakers and tech companies are building competing platforms.
Auto sector cyclicality. GM's earnings are exposed to the broader economic cycle in ways software companies are not. A U.S. recession that softens truck demand, tightens credit availability at GM Financial, or compresses used-car residuals could dent earnings across all segments simultaneously.
GM Stock vs. Ford Stock
| Metric | GM | Ford (F) |
|---|---|---|
| 2025 Revenue | $185 billion | ~$185 billion |
| 2026 EBIT Guidance | $13.5B to $15.5B | Not directly comparable (restructuring underway) |
| Forward P/E | ~6x | N/A (negative trailing earnings) |
| Free Cash Flow (2026 guidance) | $9B to $11B | Lower and less predictable |
| Quarterly Dividend | $0.18/share | $0.15/share (variable) |
| Share Buyback Program | $6B new authorization (2026) | No active buyback |
| EV Strategy | Recalibrating; EV losses shrinking | Continuing heavy EV investment; Model e losses ongoing |
| Truck Franchise | Full-size pickup leader 6 consecutive years | Strong with F-Series; direct competitor in full-size pickups |
| Software / Services | OnStar 12M subscribers; $25B 2030 revenue target | Ford Pro Intelligence growing; smaller disclosed subscriber base |
GM and Ford are often compared as peer U.S. automakers, but their capital allocation strategies currently diverge. GM is aggressively returning cash to shareholders while simultaneously shrinking EV losses. Ford is investing more heavily in its electric vehicle lineup, which has produced losses in its Model e segment, while its Ford Pro commercial vehicle business generates strong margins.
For investors prioritizing current valuation and capital return, GM's combination of a approximately 6x forward PE and active buybacks gives it an advantage in the near term. Ford's heavier EV investment may pay off over a longer horizon if EV adoption accelerates, but near-term free cash flow is lower and less predictable.
Analyst Price Targets and Wall Street Consensus
As of May 2026, 26 Wall Street analysts cover GM with an average 12-month price target of approximately $94 to $96. The consensus rating is Buy, with 19 analysts rating the stock Buy or Strong Buy, 6 rating it Hold, and 2 rating it Sell.
Notable analyst positions include:
- Barclays (January 2026): Overweight, $110 price target
- Wolfe Research (March 2026): Outperform, $96 price target
- Wells Fargo (most conservative on the Street): target implying roughly 20% downside from levels around $76
The Street's bull case is built on the same factors laid out above: cheap forward valuation, aggressive buybacks, and growing software revenue. The bears focus on tariff uncertainty, EV cost overruns, and the risk that guidance misses if the consumer spending environment softens.
GM stock rose approximately 65% in the 12 months preceding May 2026, largely as the market re-rated the company's ability to sustain earnings through the EV transition. The stock still trades well below the consensus analyst target, which implies the market has not yet fully priced in the forward earnings and buyback trajectory.
Frequently Asked Questions for General Motors Stock
Is GM stock a good buy in 2026?
GM stock trades at approximately 6x forward earnings with $9 to $11 billion in projected free cash flow and an active $6 billion buyback program, which gives it a low starting valuation compared to peers. Whether it is a good buy depends on individual risk tolerance, time horizon, and confidence in management's ability to hit guidance amid tariff uncertainty.
What is GM's forward P/E ratio?
GM's forward price-to-earnings ratio is approximately 6x, based on 2026 net income guidance of $10.3 to $11.7 billion and a diluted share count near 900 million. The trailing PE is significantly higher, near 28x in some snapshots, because of $7.2 billion in non-cash EV restructuring charges booked in Q4 2025.
Does GM pay a dividend?
Yes. GM pays a quarterly dividend of $0.18 per share, representing a 20% increase from the prior quarterly rate. At a stock price near $75, the annualized yield is approximately 0.96%. GM has doubled its quarterly dividend over the past three years.
What is GM's stock price target?
The average analyst price target for GM is approximately $94 to $96, based on coverage from 26 Wall Street analysts as of May 2026. Individual targets range from a low of $57 to a high of $122, with the majority of analysts holding Buy or Outperform ratings.
How does General Motors make money?
GM generates most of its profit from selling full-size trucks (Chevrolet Silverado, GMC Sierra) and large SUVs (Chevrolet Tahoe, Suburban, GMC Yukon, Cadillac Escalade) in North America. The GM Financial subsidiary provides auto loans and leases that contribute additional recurring revenue. A growing software and connected services segment, anchored by OnStar and Super Cruise, now generates over $750 million per quarter at roughly 70% gross margins.
What is GM's 2026 earnings guidance?
GM guided for 2026 net income of $10.3 billion to $11.7 billion and adjusted EBIT of $13.5 billion to $15.5 billion after raising its original guidance following a strong Q1 2026 earnings report. Adjusted automotive free cash flow is expected to reach $9 to $11 billion.
What happened to GM's Cruise robotaxi business?
GM stopped funding Cruise's robotaxi development in late 2024 and completed the acquisition of noncontrolling interests in Cruise in February 2025. Robotaxi operations were wound down and the autonomous driving teams from GM and Cruise were combined into the GMNA segment, shifting focus to personal vehicle autonomous technology. GM, Cruise, and Honda announced a joint venture to launch a driverless ridehail service in Japan starting in early 2026.
This article is for informational purposes only and does not constitute investment advice. Past stock performance is not indicative of future results.